Optimising your Database for Analytics
This post contains the slides and transcript from the talk that I gave at PyCon Italia 2024,
and at EuRuKo 2024.
You can also watch the video from PyCon Italia here.
"Elevator Pitch"
Your database is configured for the needs of your day-to-day application activity, but what if you need to run complex analytics queries against your application data? Let’s look at how you can optimise your database for an analytics workload without compromising the performance of your application.
Talk Abstract
Data analytics isn’t always done in a dedicated analytics database. The business wants to glean insights and value from the data that’s generated over time by your OLTP applications, and the simplest way to do that is often just to run analytics queries directly on your application database.
Of course, this almost certainly involves running complex queries, joining data from multiple tables, and working on large data sets.
If your database and code are optimised for performance of your day-to-day application activity, you’re likely to slow down your application and find yourself with analytics queries that take far too long to run.
In this talk, we’ll discuss the challenges associated with running data analytics on an existing application database. We’ll look at some of the impacts this type of workload could have on the application, and why it could cause the analytics queries themselves to perform poorly.
We’ll then look at a number of different strategies, tools and techniques that can prevent the two workloads from impacting each other. We will look at things such as architecture choices, configuration parameters, materialized views and external tools.
The focus will be on PostgreSQL, but most of the concepts are relevant to other database systems.
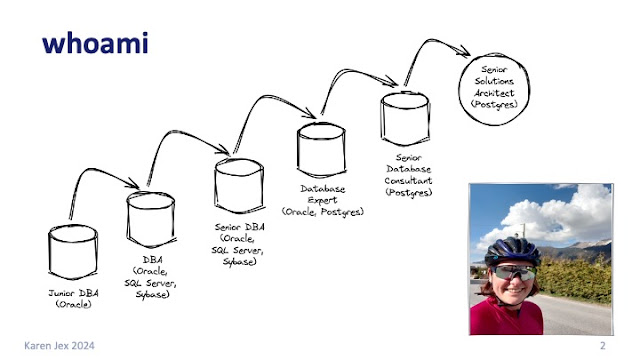
A few facts about me, just for fun (you can skip this bit if you've already seen one of my talks or read my previous posts):
When I'm speaking at a developer conference, I always feel the need to get this confession out of the way before I get too far in to the talk - I’m not a developer (sorry)!
But as you can see from this diagram of my career so far, I do know about databases, having worked with databases for 25 years now. I was a DBA for about 20 years and I was once described as "quite personable for a DBA", so make of that what you will.
I've worked with lots of developers along the way, and I've learned loads from them.
So I try to give back some of what I know about databases.

So what am I going to talk about, and why?
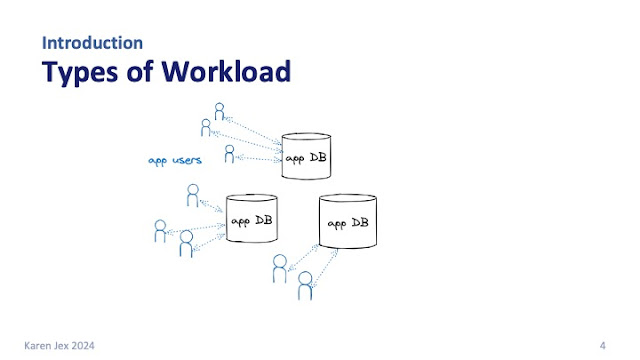
To try to answer that question, I'm going to talk about some of the different kinds of workload that you might be running against your database.
In all my diagrams you will notice that I am very much a database person and I've conveniently missed out the whole application layer. Please forgive me for that, this is my vision of the world - we have the database, and we have everything else that goes on outside of it!
You probably have an application, or maybe many applications, that have a backend database, and the database is probably constantly being queried, updated, and inserted into by your application.
It could be a traditional payroll or banking app, it could be e-commerce, or it could be one of all sorts of different applications.
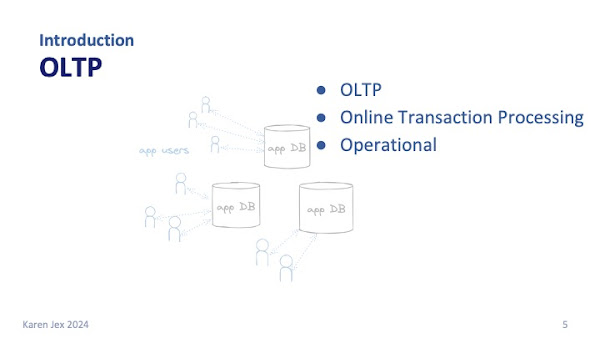
That typical, traditional database activity is what we usually hear called OLTP (online transaction processing), or sometimes operational database activity.
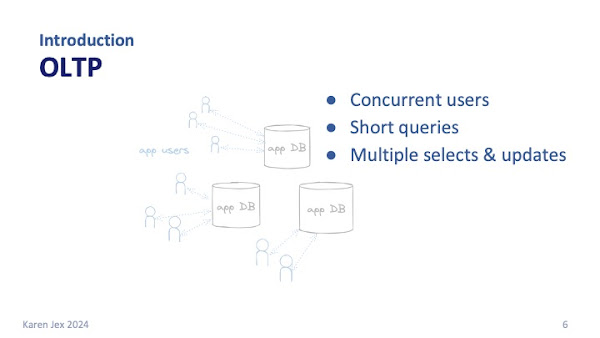
That kind of workload is characterised by lots of concurrent connections, each performing multiple short statements per transaction. Several quick selects, inserts or updates of just a single row for example.
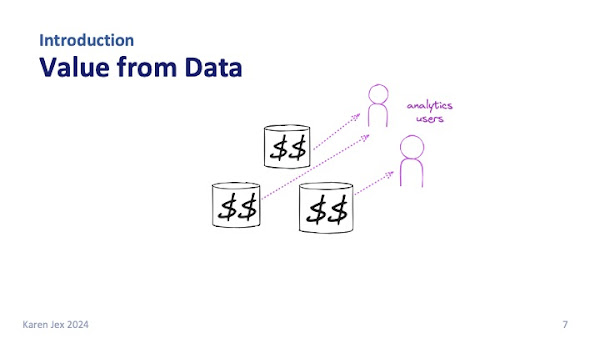
This type of application will gradually build up data over time.
(And there's often no strategy for purging obsolete data, so it keeps on growing, but that's a a different story...)
At some point the business wants to glean insights from, i.e. make money from, this data, and that means you're going to need to run analytics queries.
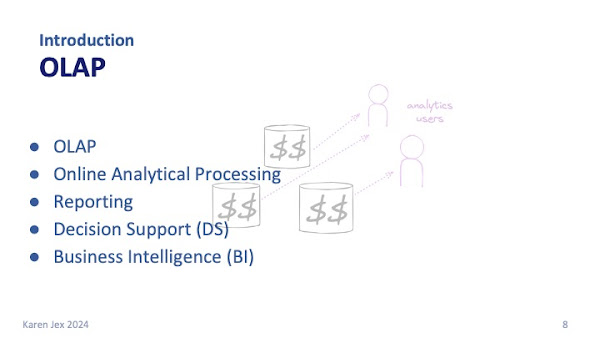
Analytics workload can take many different forms, and it's got lots of different names. It's sometimes known as:
- OLAP (online analytical processing)
- Reporting
- Decision Support (DS)
- Business Intelligence (BI)
Basically, activity that’s designed to answer real-world business questions. It might be something like:
"how successful was our last marketing campaign?"
or
"What's the impact on our CO2 emissions of performing this action compared to this one?"
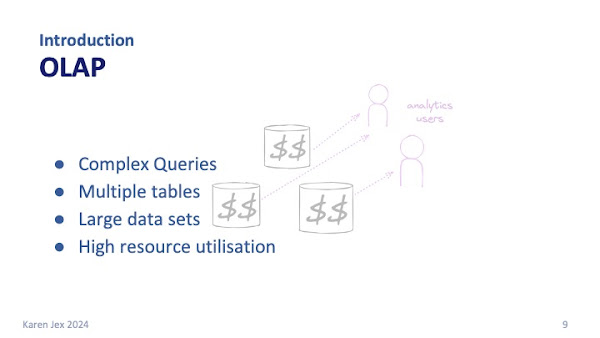
This OLAP type activity typically involves much longer, more complex queries. It will generally be select activity, often joining data from multiple tables, and working on large data sets.p>
This means it's often very resource intensive.
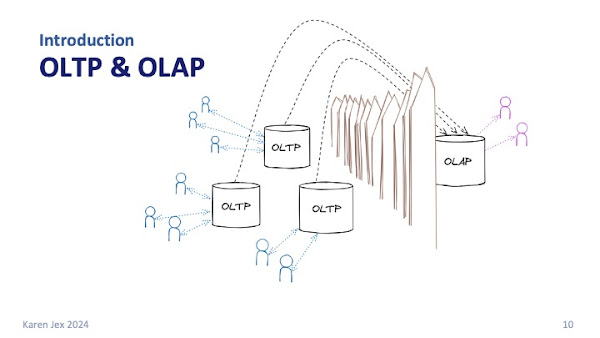
Once upon a time, we had the OLTP databases and we had the analytics or OLAP databases and the two were very much separate.
Data would somehow be extracted from the OLTP systems and imported into the OLAP system. That could be by an overnight batch process or sometimes even a weekly roll up of the accumulated application data.
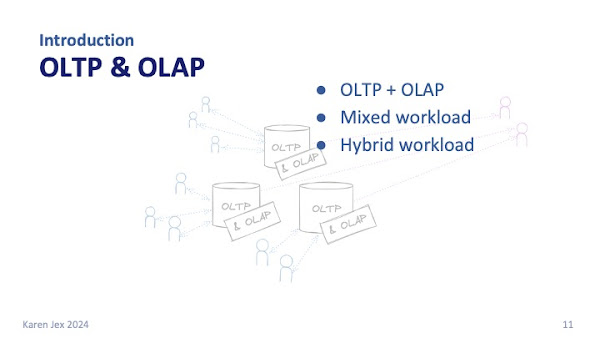
That does sometimes still happen, and there are good reasons for doing it in some cases, but often the business doesn't want to wait overnight or until the next week for that data. It wants to get value from data where it is, in real-time, which often means directly querying the OLTP systems.
Where you've got this OLTP plus OLAP activity in the same database, you'll hear it called a mixed or a hybrid workload.
That's the kind of activity that we're going to be talking about today.
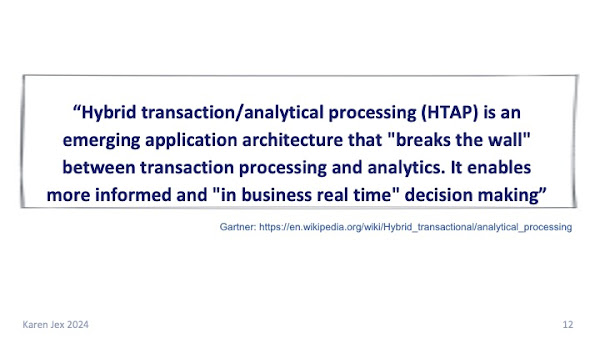
It’s not a new idea.
Gartner came up with the term HTAP (Hybrid transaction/analytical processing) back in around 2010 and it’s been described in other places as Translytical or HOAP (Hybrid operational and analytical processing).

So what's the problem with this?
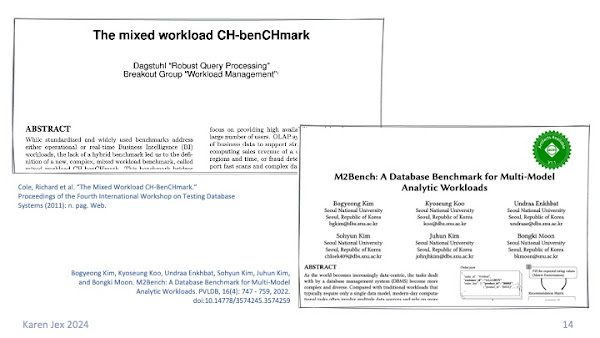
It's well established in academic circles that this type of workload presents unique performance challenges. I've seen papers from 2010 where researchers identified the fact that running mixed workloads can cause performance issues. And there are ongoing discussions about the best types of benchmarking etc. to look into the performance of this type of workload.
But I imagine you'll be pleased to know that I'm not planning an academic discussion!
I want to focus on the practicalities of what you can do if you're in the situation where you've got a mixed workload, i.e. how you can make sure you've got performant analytics queries that have minimal impact on your operational database activity.
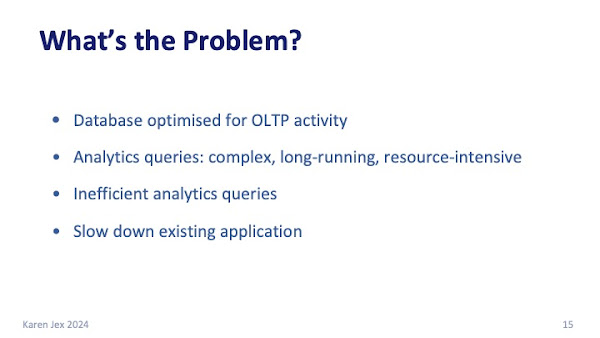
To recap: The chances are that your database is optimised for your day-to-day OLTP activity (lots of short selects, inserts, updates run by multiple concurrent users).
Once you add analytics activity into the mix (much more complex, resource-intensive, long running queries working on big data sets) you can actually end with the worst of both worlds:
Inefficient analytics queries that also slow down your day to day application activity.
Now that we've identified the problem that we're trying to solve, next we need to set up an environment so that we can test things out.
I'm using Postgres for this because that's the RDBMS that I work with day to day, the one I know and love, and also it's very quick and easy to set up and and work with to test things.
I'm going to be using pgbench, which is a simple benchmarking tool that's available by default with Postgres.
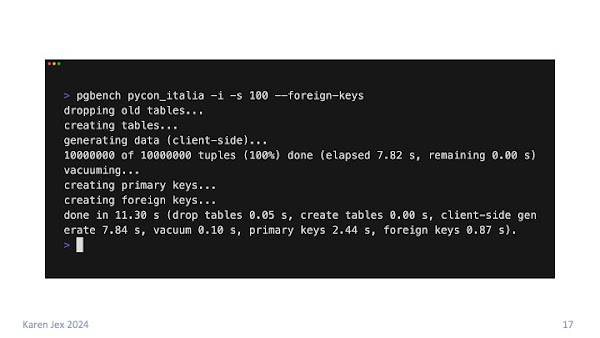
First, we create and populate the pgbench tables by running pgbench:
- With the -i (initialise) flag.
- In a database that I pre-created called pycon_italia.
- With a scale factor (-s) of 100.
- With foreign keys (--foreign-keys) between the tables
to represent an OLTP database.
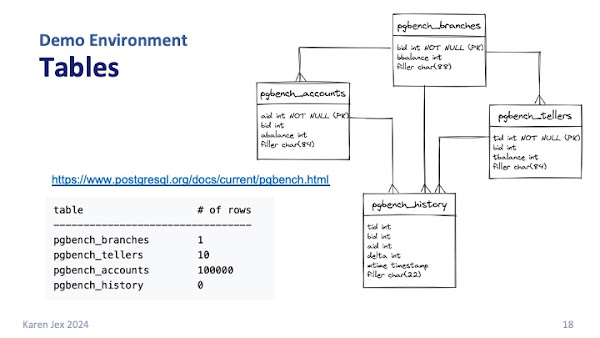
It creates 4 tables for us:
- pgbench_branches
- pgbench_tellers
- pgbench_accounts
- pgbench_history
The number of rows listed here is what you'd get with scale factor 1. We set scale factor to 100 which is how we ended up with 10 million rows in our bgbench accounts table.
The history table starts out empty at the beginning of each pgbench run.
I included a link to the documentation so you can read more about it.
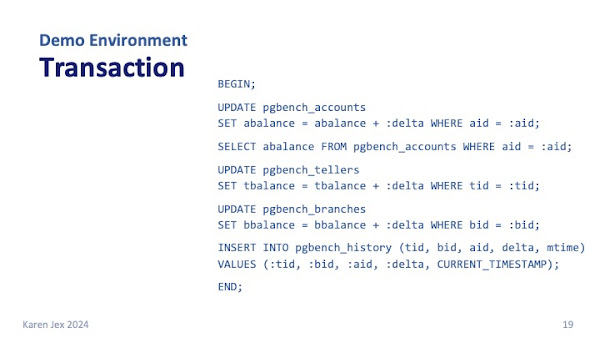
By default pgbench simulates OLTP activity by repeatedly running the transaction shown on this slide, loosely based on the TPC-B benchmark. You can tell pgbench to run a script of your choice if you prefer, but the default is fine for our purposes.
Each transaction is made up of several SQL statements (3 UPDATES, a SELECT and an INSERT) and takes random values of aid, tid, bid and delta.
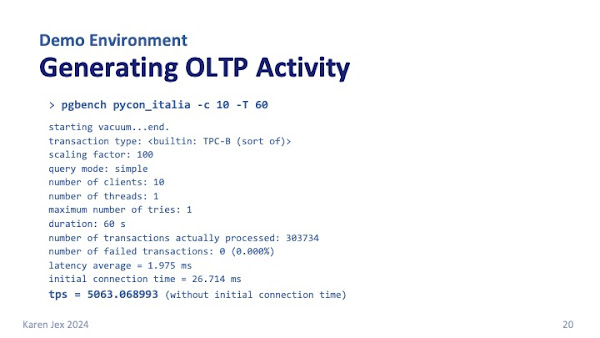
When you want to simulate some activity on your database, you run pgbench without the -i.
This slide shows me calling pgbench to run
- for 60 seconds (-T 60).
- with 10 concurrent clients (-C 10).
The output will show you how many transactions were processed, what the connection time and latency were etc. In this case, for example, you can see we had around 5k transactions per second.
Note all this is just running on my laptop - the goal is to give an idea of what you might see, not to get the best possible performance.
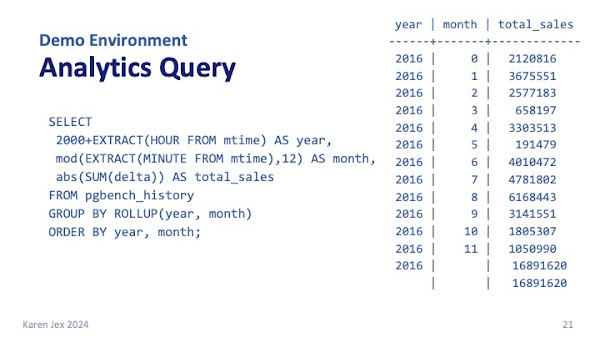
I then mocked up an “annual sales report” analytics query against the pgbench_history table:
SELECT
2000+EXTRACT(HOUR FROM mtime) AS year,
mod(EXTRACT(MINUTE FROM mtime),12) AS month,
abs(SUM(delta)) AS total_sales
FROM pgbench_history
GROUP BY ROLLUP(year, month)
ORDER BY year, month;
The query:
- Extracts (something representing) year and month from the mtime column.
- Groups and orders by year and month.
- Calculates totals.
If you actually do analytics you'll notice that this is extremely simple as analytics queries go, but it's good enough for demo purposes. In the real world, this would probably be just one building block of a ctibigger analytics query.
The slide shows the results after running pgbench for 20 minutes and generating about 15 million rows in the pgbench table.
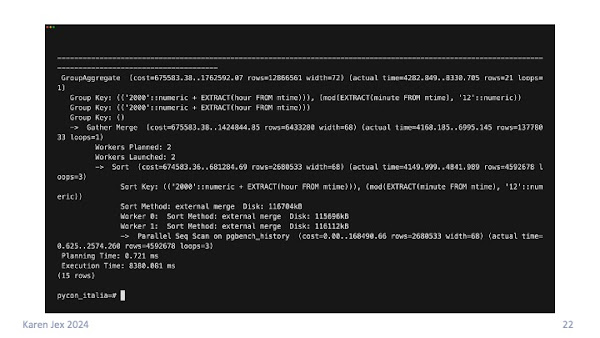
Let's have a look at the execution plan for the query so we can see what it's doing behind the scenes. To do that, I'm using the EXPLAIN command with the ANALYZE option.
I connect to my database via psql, the PostgreSQL command line tool, type EXPLAIN ANALYZE and then the query. The ANALYZE keyword tells it to actually run the query, to get the real stats rather than an estimate.
The slide shows the query taking around 8 seconds to complete. It does a sequential scan on pgbench_history (it has to scan the whole table), and we can see external merge sorts meaning it's creating temporary files on disk.
Just for comparison, the select in the pgbench transaction takes around a millisecond.

Now we've got the environment in place, let's have a look at some of the different things that you can do to optimise that analytics activity without having too much of an impact on your day-to-day application activity.
This is not going to be an exhaustive list of all the things you can do. It's not even a full performance tuning exercise of just this one query. The idea is to give you an idea of the different areas that you can look at so you can try things out and see how they go.
The details are specific to Postgres but the general ideas are relevant for any RDBMS.
As I mentioned before, your database is probably (hopefully) tuned for your day-to-day application activity, so your database configuration parameters have been carefully considered and set accordingly. If not, I highly recommend having a look at them.

That gave me an excuse for a shameless plug!
This slide contains a link to a talk that I gave at DjangoCon Europe 2023 on that very subject: Tuning PostgreSQL to work even better.
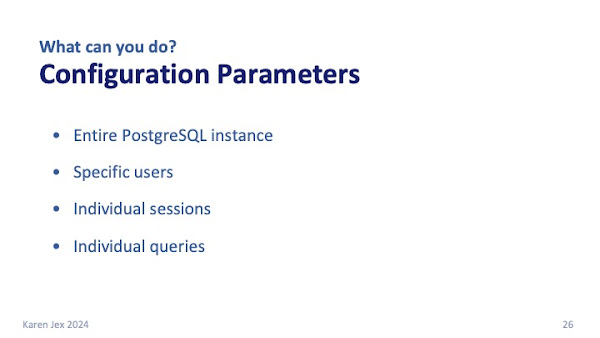
- Some parameters need to be set across the whole of your database instance.
- Some parameters can be set for individual users or individual sessions.
- Some can be set for individual statements.
For the ones that have to be set across your whole Postgres instance, you're going to have to find some kind of compromise that works for your OLTP activity as well as your analytics activity. That part can be a bit of a challenge.
I'm just going to talk about a few parameters, and I encourage you to go away and read the Postgres docs, where you can find a full list of all the different parameters, what they do, what the default values are etc.
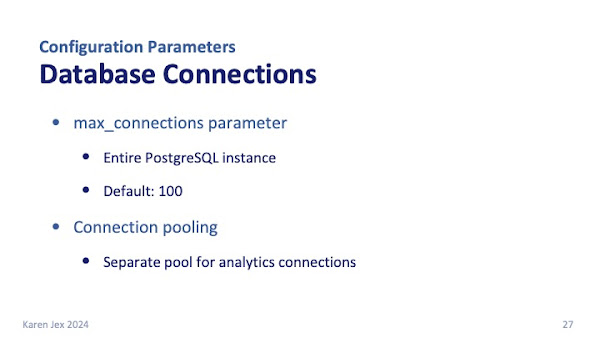
Database Connections
The chances are, you won't have all that many concurrent analytics connections, but those connections are likely to be using a lot of resources, so you probably want to keep an eye on them and make sure there aren't too many of them.
The max_connections parameter specifies the maximum number of concurrent client connections allowed for the entire instance.
It's 100 by default, and on most systems and you don’t want to increase it too much higher than that (definitely no more than a few hundred if you can help it).
You probably want to limit the number of analytics connections to a much smaller number. To do that you might want to look at connection pooling* so you can create a separate, smaller, pool for analytics connections.
*For example using PgBouncer.
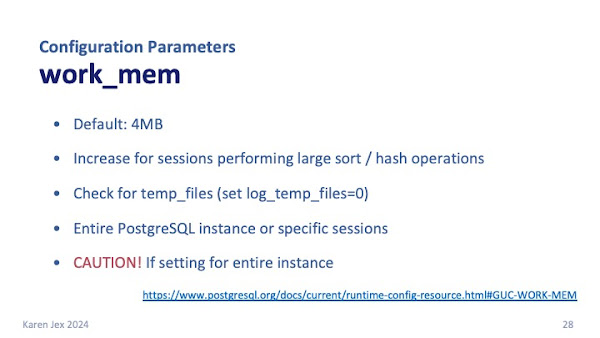
work_mem
work_mem says how much memory a query operation can use before spilling to disk and creating a temporary file.
By default it's 4MB but complex queries that perform large sort or hash operations can benefit from a larger value.
You can check if work_mem needs to be increased by watching for creation of temp files:
Set log_temp_files to 0 to write this information to your Postgres logs.
Just be aware that a complex query might run multiple sort or hash operations in parallel, and that several running sessions could be doing that type of operation concurrently, so you can end up using a lot of memory.
To avoid using too much memory, you can set work_mem to a high value just for specific analytics sessions, and limit the number of them.
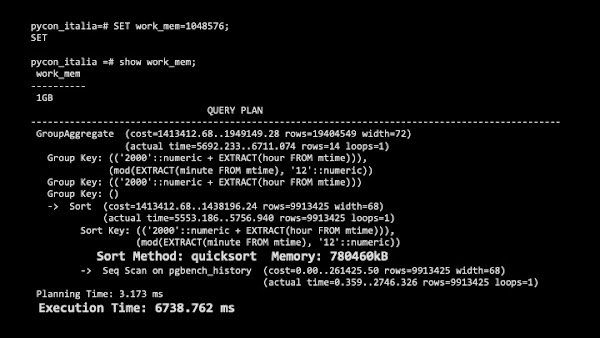
I tested out the analytics query with different values of work_mem.
I tried it with 100 MB, which still gave a disk sort and didn't make any difference to the execution time.
When I set it to 1GB, just to see the effect, it moved the sort to memory (we see a "quicksort" in the execution plan) and reduced the execution time slightly, but it still took over 6 seconds.
I don't know about you, but that doesn't feel like a great tradeoff to me for the sake of using almost 1GB of memory just for that one simple query!
It will, of course, vary from case to case so it's worth testing out for your particular queries to find the best value.
statement_timeout
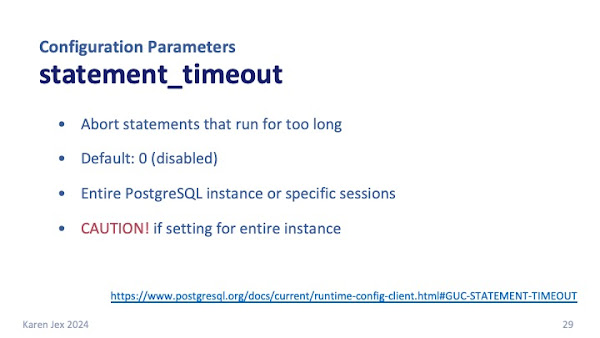
If you're concerned that you're going to have analytics queries that run for too long and therefore cause performance issues on your database, you could set statement_timeout, which will abort any statement that runs for longer than a given amount of time.
It's disabled by default, so statements can run for as long as they need to.
You can set it for the entire instance, but it's probably better to to do it for individual sessions or groups of sessions. Certain analytics queries might be OK running for many minutes, but you might expect statements executed via your application to take milliseconds.
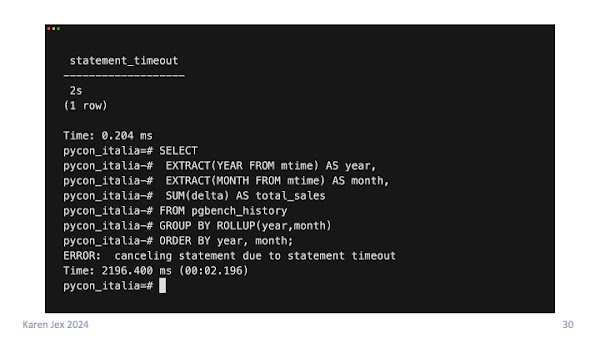
To demonstrate this, I set statement_timeout to 2 seconds and then tried rerunning our analytics query. You can see it was cancelled after just over 2 seconds with the message canceling statement due to statement timeout.
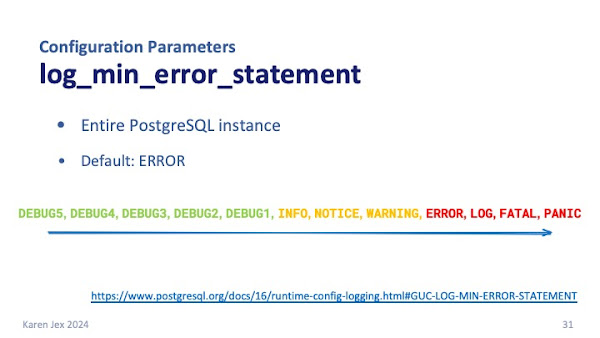
if you want to know when this has happened, make sure that log_min_error_statement is set to ERROR (the default) or above. That means that actions with severity ERROR, LOG, FATAL or PANIC are written to the Postgres logs, so any statement that is cancelled due to statement_timeout will recorded.
The slide shows the possible values of log_min_error_statement, from least severe (DEBUG5) through to the most severe (FATAL then PANIC).
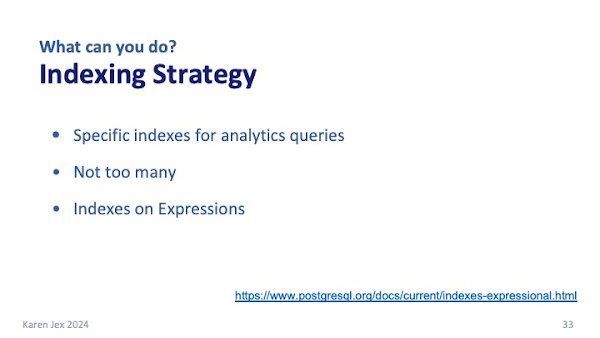
You'll probably need specific indexes for your analytics queries.
Just be aware that as well as needing space, indexes need to be maintained. Although indexes can improve performance of selects, they can impact the performance of your inserts and updates.
So you don't want to be adding too many indexes - you want just the ones that are actually really going to help with your queries.
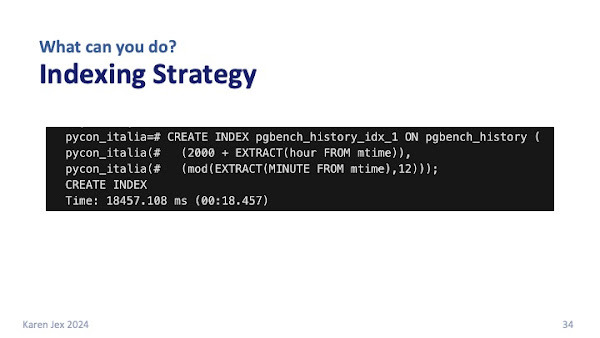
As well as creating indexes on one or more table columns, you can also create indexes on functions or scalar expressions based on your table columns.
For example, our analytics query uses expressions to extract year and month from the mtime column. If we created an index on the mtime column, the query planner wouldn’t be able to use it for this query.
What we can do instead is to create an index on the expressions that are used in the query:
2000+EXTRACT(HOUR FROM mtime) and mod(EXTRACT(MINUTE FROM mtime),12).
Pre-Calculating Data
Most analytics queries aggregate, sort and calculate large quantities of data: totals, averages, comparisons, groupings etc.
If you pre-calculate, pre-sort and pre-aggregate some of the data that's needed in your analytics queries, you can do it just once so you it doesn't have to be done every time you run your analytics queries.
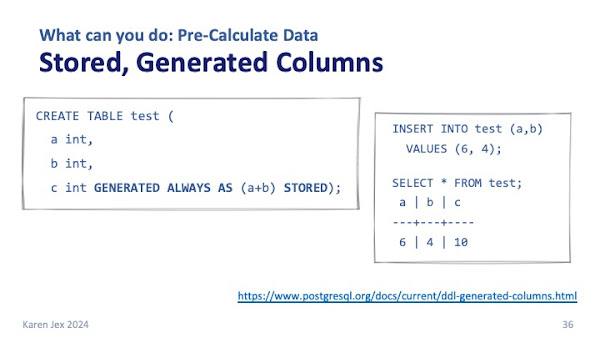
You can create generated columns in a table with the GENERATED ALWAYS AS keywords.
This means that the column value will be calculated automatically based on the expression; in this case the sum of the columns a and b.
The STORED keyword says that it should be physically stored in the table rather than calculated at query-time.
If we insert values into cols a and b, you can see that c has been calculated automatically.
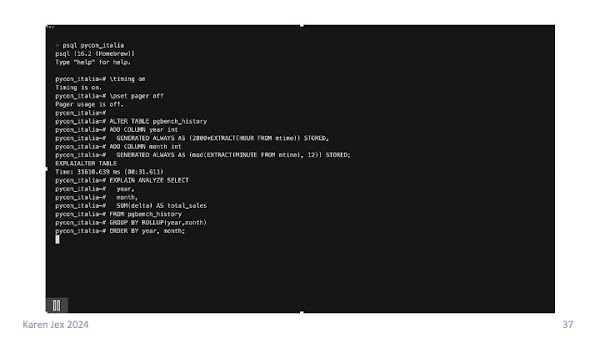
We can add year and month columns to our pgbench_history table, telling Postgres to generate the value automatically using the expressions in our analytics query.
It takes several seconds to add the columns in this case because the table is pre-populated. It has to calculate the values and update all of the rows that are already in the table.
Be aware, of course, that this will affect inserts into the table.
Now, we can use the calculated columns year and month in our query instead of having to calculate them each time. In this case, the execution time went down to just over 3 seconds.
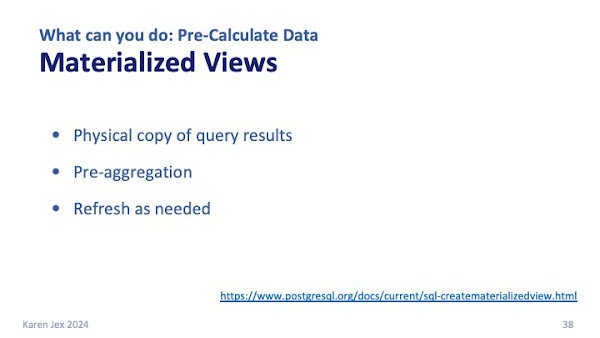
Materialized views are another useful way to pre-aggregate and pre-sort your data.
A materialized view is a physical copy of the results of a query.
As I said before, our "analytics query" could be just one building block in a bigger query.
We can create a materialized view based on our query, and whenever we want to use that block in a bigger query, we don't have to go to the base tables and re-calculate everything, we can just select from the materialized view where it's already been calculated, aggregated and sorted.
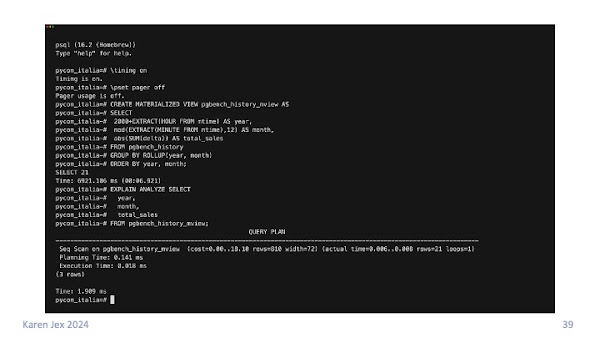
When I did this it took the execution time down to a few milliseconds because we we're just looking at the 14 rows in the pre-calculated materialized view.
Finally, the best way to avoid impacting your application database is probably by not running analytics queries against it at all.
Even if you don’t have a completely separate analytics environment, there are still some options that might be available to you.
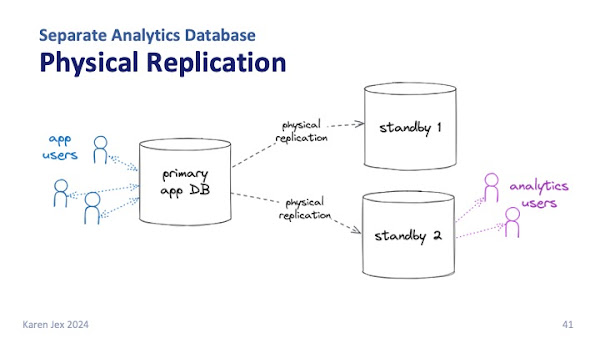
You've probably already got a high availability architecture in place, which usually means you have one or more standby databases that are kept in sync with the primary via physical replication.
The replica databases are available for read-only transactions, so you could send your analytics workload to one of them to take load off your primary application database.
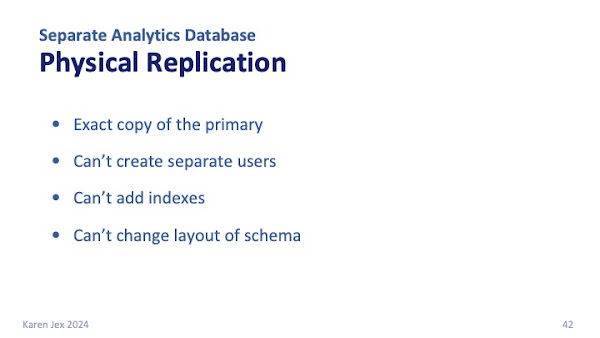
Just be aware that physical replication gives you an exact copy of the primary database cluster, and you can't make any changes on the standby. You can’t create separate users, create indexes, change the layout of the schema etc.
Any changes have to be made on the primary and propagated across.
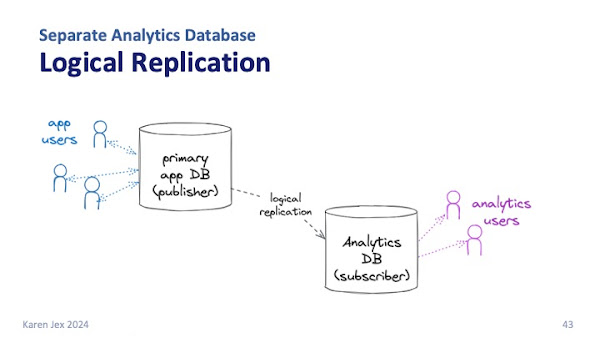
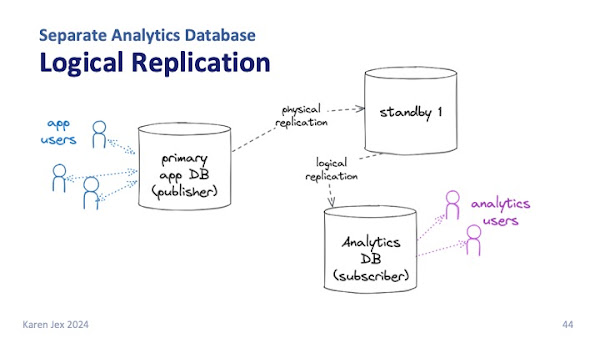
From Postgres version 16 onwards, you can also set up logical replication from a standby, which can take even more pressure off your primary database.
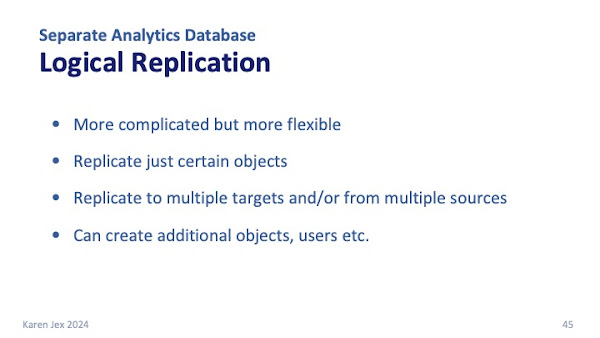
Logical replication is more complicated to put in place and maintain than physical replication, but it's more flexible. You can:
- Replicate just a selection of objects.
- Replicate to/from multiple targets/sources.
- Make the subscriber database available for read-write activity.
- Create indexes, users, materialized views etc. on the subscriber database.
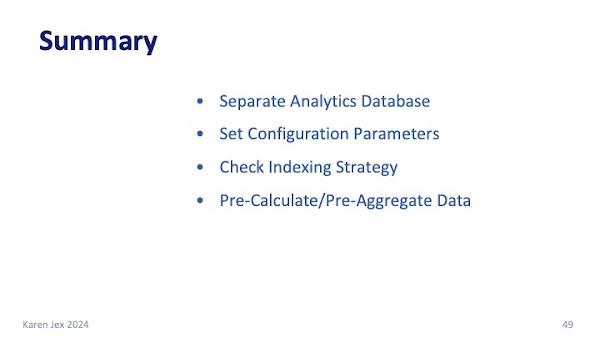
In summary: we looked at various techniques to make sure your database is optimised for analytics without slowing down your application.
- If you can, use physical or logical replication to create a
separate database for your analytics workload. - Tune configuration parameters for your hybrid workload.
- Consider your indexing strategies, including indexes on expressions.
- Create generated columns or materialized views to pre-aggregate, pre-sort and pre-calculate data.
- You can combine the various techniques to get the results you need.
Hopefully this has given you some useful information and enough of a starting point to go away and have a look at the different things that you could do in your environment.

Thank you for reading!
Get in touch, or follow me for more database chat.
LinkedIn: https://www.linkedin.com/in/karenhjex/
Mastodon: @karenhjex@mastodon.online
X: @karenhjex