#PGSQLPhriday 013: Unlocking Open Data using PostgreSQL
Introduction
For #PGSQLPhriday 013, with his challenge "Use cases and Why PostgreSQL", Chris Ellis wants to hear about the weird and varied things that people are using PostgreSQL for.
For some reason, this is the challenge that has finally pushed me to participate in the monthly blog event created by Ryan Booz. A big thank you to Ryan, and to all the hosts and participants so far!
In my role as a solutions architect, I don't often get to work on exciting PostgreSQL use-cases of my own - I'm usually busy supporting customers with their database environments so they can get on with working on the exciting stuff. But I'm also doing a part-time PhD in Computer Science at the University of Manchester, where I'm looking at automatic table discovery in semi-structured spreadsheet and CSV files from Open Data sources.
I'm completely out of my depth and out of my comfort zone doing a PhD. I'm not a researcher and I'm not a data scientist. Two things that would be really handy here! I'm learning a lot of new techniques and information as I go along, but I also appreciate being able to take advantage of technology that's more comfortable to me. At the moment, I'm using a PostgreSQL database to help compare and evaluate various systems that have been created by other research teams.
First, a bit of background...
You can skip this bit and go straight to "What I'm doing with Postgres" if you want a shorter read.
There’s a huge amount of open data out there. The European Data Portal alone contains over 1.5 million data sets, made available by some 250 different publishers. These publishers represent diverse bodies, each with their own practices, and the data sets span categories such as the economy, environment, health, science & technology. There are many different file types, and the data are often presented in a human-readable rather than machine-readable format.
This diversity and lack of structure means that painstaking manual intervention is usually needed if you want to make sense of the data and load it into a database for analysis. The
goal of my research is to reduce the manual intervention required to extract data.
In my research, I'm focusing on CSV and Excel formats, which together represent almost a quarter of the data sets in the European data portal.
Some files (such as the following example from Kaggle) are simple, and it's fairly easy to see how they could be converted to a relational table and imported into a database.
| https://www.kaggle.com/datasets/johnharshith/world-happiness-report-2021-worldwide-mortality |
But most files are more complicated than this and are much more difficult to interpret, such as the following example from data.gov.uk that includes header and footer, hierarchical column headings, summary data, aggregated data and more.
| https://data.gov.uk/dataset/1f9e8832-d668-43ff-9511-d01f8ce0af22/ handwashing-consumer-tracker |
There are, of course, existing tools that can help you to extract data from a flat file and import it into a database; commercial ETL tools, spreadsheets and DBMS loader tools, for example. These can be useful if your input is a structured file in a specific format, and you have detailed knowledge of the structure of the file and of the data itself. But even then, they often require a reasonable amount of manual intervention to extract the data correctly.
There are also several research groups working in this area. My first task was to evaluate the different systems they propose, to understand what has already been done, identify gaps, and decide on the direction of my own research. This turned out to be much more complicated than first thought because each piece of research works on a slightly different piece of the puzzle, uses a different programming language, a different method, different input and output formats, different evaluation methods etc.
What I'm doing with Postgres
I ended up creating a framework that can be used to "plug in" different table extraction methods to be evaluated and compare them against a chosen dataset. It looks a bit like this:
The tests start with a dataset. A dataset comprises a set of spreadsheet or csv files that contain tables, along with a set of "ground truth" files that represent the "correct" way in which tables should be extracted from the file. Obviously "correct" here is subjective - there may be multiple, equally valid ways in which one or more tables could be extracted from a given file. The dataset I'm currently working with can be found here.
During the "Extract tables" step, each of the systems being evaluated is run against the set of data files, which generates a set of output files. Each system has its own format for this output (e.g. JSON, csv, xls) and each contains a different level of detail, different type of information etc.
To cut through some of this complexity, a central part of the framework is a generic "table model". This is a relational model that represents the different elements of an identified table. I created my version based on the table model defined in TabbyXL[1], adapting it just enough to make it work for all of the systems being tested.
In its simplest form, the model looks like this:
The tables defined in the model are created (of course) in a Postgres database and populated during the "Map ground truth to table model" and "Map output to table model" steps of the process.
The
mapping step translates the information in each ground truth or output file into rows in the table_model database:
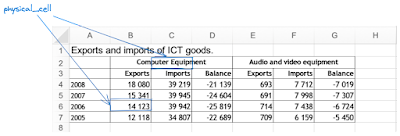
A physical_cell represents a single cell in the original file:
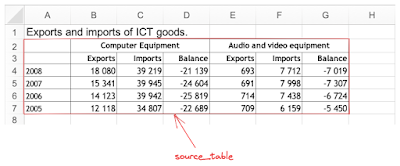
A source_table is made up of one or more table_cells. A table_cell is a rectangular group of one or more individual cells within a table, for example the merged cells E2,F2,G2 containing the value "Audio and video equipment":
An entry is a table_cell containing a data value, and a label is a table_cell containing a column or row heading.
Once the table model tables have been populated, the evaluation phase just needs to compare the rows that represent the ground truth against the rows that represent the output. To evaluate how well each system performed, we can look at things like how many of the entries or labels were correctly identified for each table, and whether or not the start and end of the data rows was correctly identified.
The framework is still very much a work in progress, and it's only a small part of the work I need to do, but it's been a fun exercise so far and I'm glad to be able to share a bit of it with you.
I think the kindest thing I can say about my code at the moment is that "it's got potential", but in the spirit of open source and open data, here's a link to it in case you're interested in having a look!
Reference:
[1] A Shigarov, V Khristyuk, and A Mikhailov. “TabbyXL: Software platform for rule-based spreadsheet data extraction and transformation Code metadata”. In: SoftwareX 10 (2019), p. 100270. doi: 10.24433/CO.8210587. v1.


